There are many amazing retirement simulators out there like Empower’s and CFIREsim.
THIS IS NOT ONE OF THEM.
But that is the point.
In my Time to FI Spreadsheet, you plug in a few things and you’re done!
It’ll give you a general idea of your “Time to FI” and you can begin to eye potential retirement dates. But that’s it!
But if you are anything like me, it really helps to see the numbers, play with them, and get an understanding of the underlying levers on the path to Financial Independence.
My spreadsheet works with both Google Sheets and Microsoft Excel. It is a simple and easy-to-use template. Instructions below!
How to Use The Time to FI Spreadsheet
As you head towards retirement (or even if you are a long way off), you still want to know how your current financial plan is looking.
That is why I turn to my Time to FIRE Spreadsheet.
Here’s how to use it:
- For both Google Sheets and Microsoft Excel users, click here to “make a copy” of the Time to FI(RE) Spreadsheet
- For Excel users only, you will then want to click “File” then –> “Download” –> “Microsoft Excel (.xlsx)”
- That’s it then you are off and running!
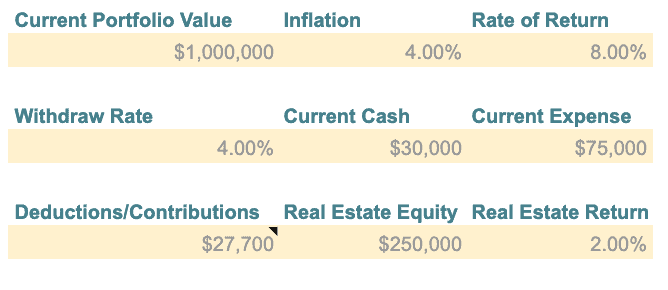
Once you’ve made a copy, you can start to modify input variables:

As you can see, you can input everything from your Current Portfolio Value to you’re estimated Withdrawl Rate.
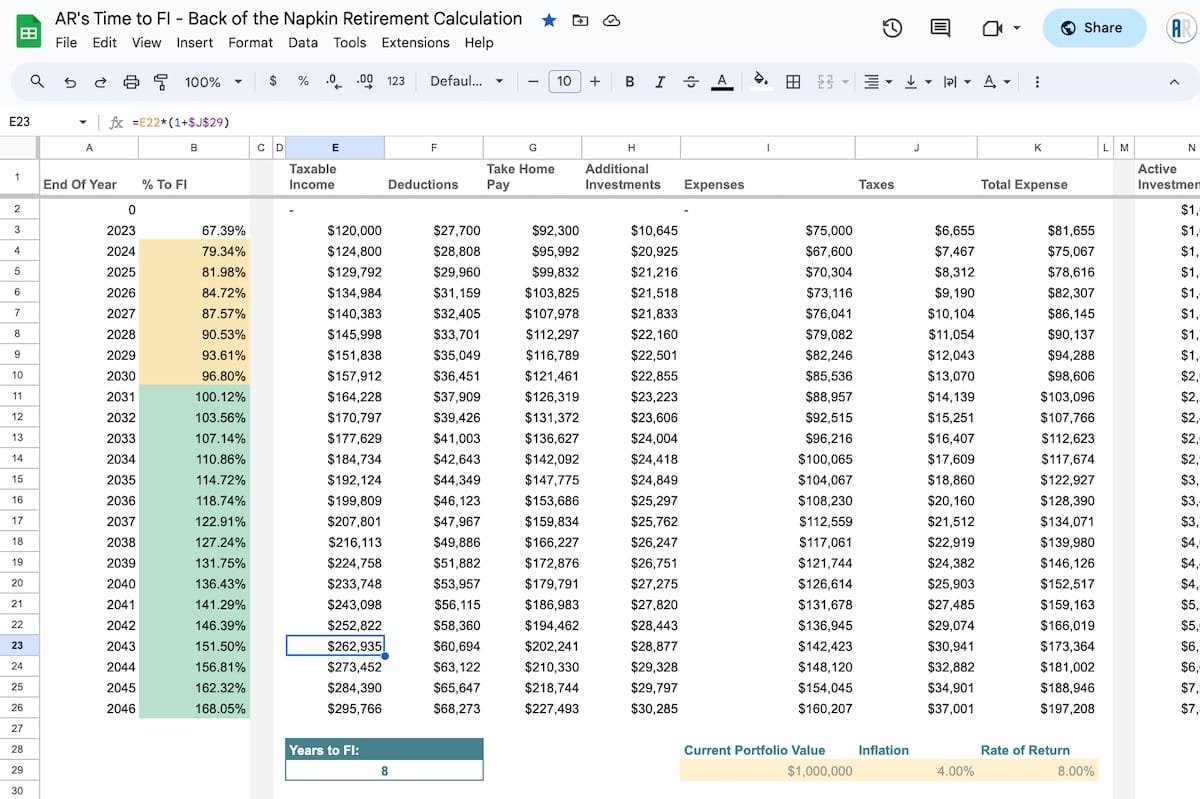
Play with the file as you desire and it will begin to show you your estimated Time to FI:

As you can see with the default data I put in, the spreadsheet is calculating out 8 years to FI!
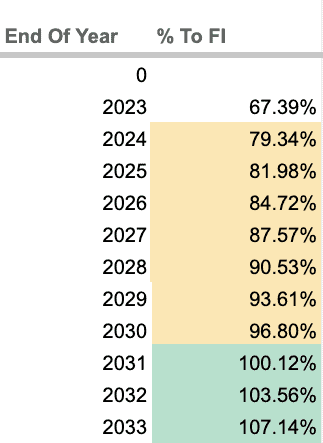
You’ll see corresponding percentages by year, so you can see how the levers change as you make tweaks to your Income, Expenses, etc:

You absolutely can and should make changes to this spreadsheet.
It is YOURS.
Make manual overrides, give yourself expected pay bumps, or estimate how pay cuts impact your finances.
But mostly, you’ll be able to get a back-of-the-napkin estimate of your Time to FI, so that you can begin to eyeball a retirement date!
I’ve pre-filled the spreadsheet with example information to make it easy to see how it all comes together.
How Do You Calculate Out Time to FI?
Most people use the 4% rule, as a general “rule of thumb.”
The 4% rule states that you can safely withdraw 4% of your portfolio each year and still have a darn good chance of never running out of money.
Another way of thinking about this calculation is how many years’ worth of expenses are in your portfolio to ensure that it can be drawn down without depleting.
Many people estimate that you need 25 times your expenses (this is tied in with the 4% rule as 100% / 4% = 25).
But the 4% rule is not foolproof. It may not even be safe in many circumstances.
So it might be safer for you to go with 3.5% or even 3.25% depending on how early you retire and the economic conditions under which you retire.
In the spreadsheet, you can modify the percentage within the spreadsheet, and the calculator will automatically adjust the amount that you’ll need for retirement.
Play around, and let me know how you like it!
If you find any errors, please let me know in the comments below.


Hello! Where would I include my post-tax retirement contributions (Roth through my work)? Also, I contribute to a pension, so should I include that amount annually under pre-tax or should I not include it because it isn’t really compounding (instead I could either take the lump sum, if I left, or collect a set-amount pension when I retire/hit retirement age according to my employer)? Thanks so much!
Good questions!
For the ROTH, since those contributions aren’t tax deductible and you pay tax on them, we really want them to show up in the “additional investments” tab. So for that, simply don’t count them as an expense and it should auto-populate there.
I believe pension plans are tax-deferred, so I think you could add them in as Taxable Income in column E for when you retire. You could probably make some further tweaks to the spreadsheet and add them in as their own new column between P and Q to account for the growth each year and track it in your Net Worth. I think regardless, just make sure you account for any taxes you will have to pay on the pension distributions.
Hi, I’m not sure if you’re still active on this site but first off thank you so much for publishing your spreadsheet. Of all the spreadsheets I’ve come across that are free, I find yours to be the most useful. However, I had a question about the “tax” column.. when I look at my paychecks I’m taxed much higher but I’m not sure what to change in your tax equation to get a more accurate representation of my income. I would greatly appreciate it if you can share what I should edit. Thanks!
Hey Monica! Hmm I do need to update that formula to better match 2024 tax brackets. I think I also have it setup for married couples at (24400), and need to add a better way to toggle your tax status.
So if you are single, an easy first step would be to change the 24400 to 14600. But I will go ahead and update he formula and paste in here in a bit.
Ok, that is fixed here now: https://docs.google.com/spreadsheets/d/1w-o0a5kDktxzwOMxD3q6bBL1RQaF5-wkeWufrbLUhag/copy
Good catch! I recently added the standard deduction section and that messed up the tax formula. I just added a new tax sheet that calculates out the tax for each status, single, married, or head of household.
Please let me know if you find any other errors!
thank you so much!
Hi, is there a beginner instruction somewhere on how to fill this out? I struggle with the basics of financial literacy (judging by my difficulty filling out this chart). Where does my 401K contribution (maxed) go? Is the house we live in counted as real estate investment even if we have a mortgage on it still? If I make investments from my business via owner draw, where would that appear? Thanks and sorry for the silly questions
Hey Joanna – For 401(k) you would put that in contributions in I29. Yes, you can count your house as a real estate investment, because it will return something to you. Put in your equity which is the current market value minus the mortgage. As for the investments, right now it is auto-calculating based on your income minus your expenses, so I would simply add that as part of your total income.
No worries at all. Looks like I need to do a better job explaining this and giving notations!
Ok, I just updated the document if you want to go back and get a new copy. Hopefully its a bit more clear!
Hi and thank you for this resource. If you’re open to adding descriptors in all of the yellow input cells (similar to what you did in cell I35), that would help me better understand if I’ve populated those cells with the correct values!
Yes, definitely seems that I need to!
Ok – all set there. It has been updated!
Just starting to play around with this. Thanks for making it. I’m curious as to why cell I4 deducts $10,000 off your expenses.
Good catch!!
Looks like it was left in from my own personal use of trying to lower expenses by $10K the next year. Just missed it.
But I’ve gone ahead and removed it from the current version.