Should you pay down your mortgage and live debt free or invest?
My spreadsheet works with both Google Sheets and Microsoft Excel. It is a simple and easy to use template for running various pay off your mortgage vs. invest scenarios.
Pay Off Mortgage vs Invest Calculator Spreadsheet for Google Sheets & Excel
Now you can easily run scenarios with just a few clicks with the new Pay Off Mortgage vs Invest Calculator Spreadsheet.
- For both Google Sheets and Microsoft Excel users, click here to “Make a Copy” of the Pay vs. Invest Spreadsheet
- For Excel users only, you will then want to click “File” then –> “Download” –> “Microsoft Excel (.xlsx)”
- That’s it then you are off and running!
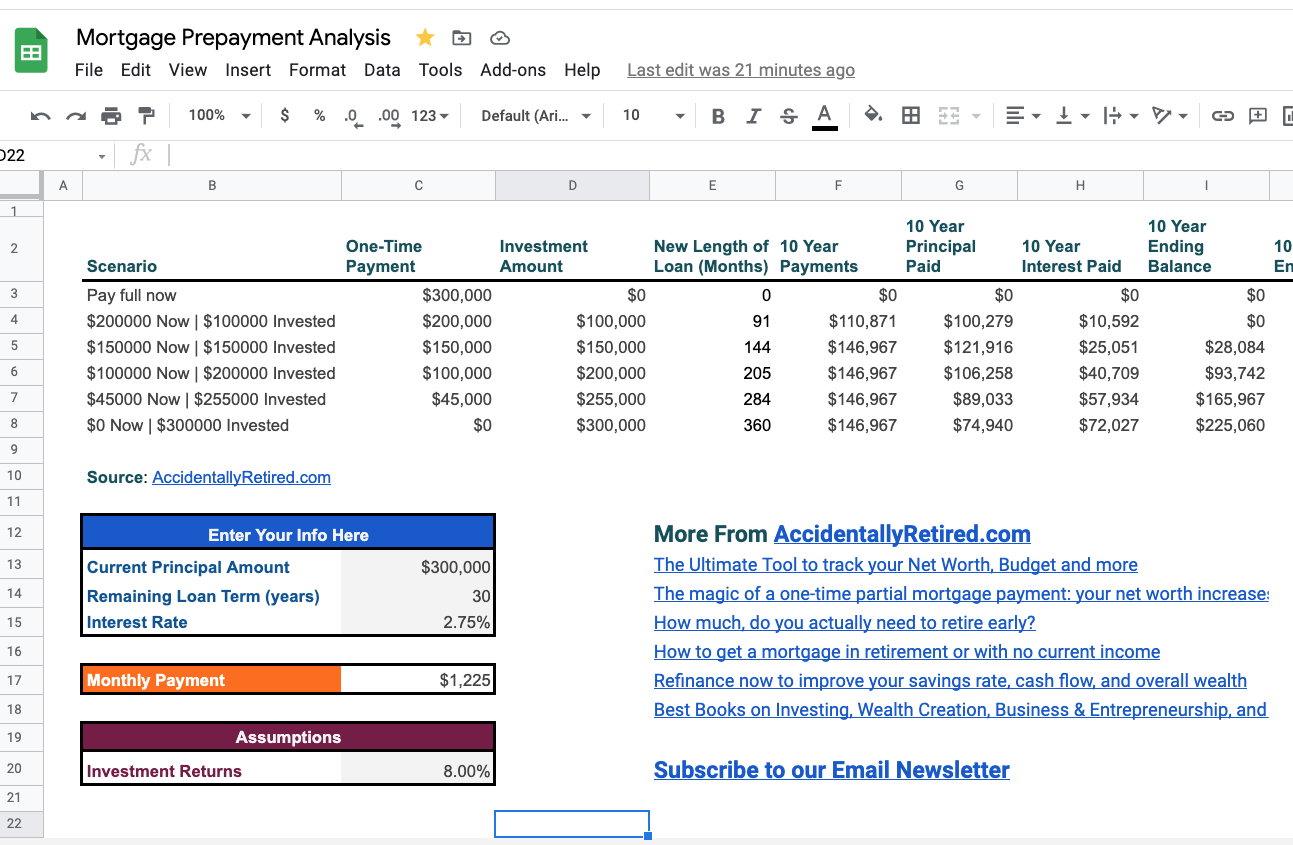
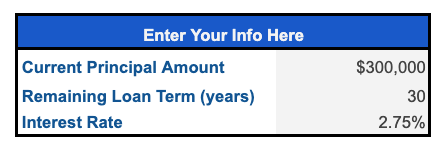
Then punch in your info here:
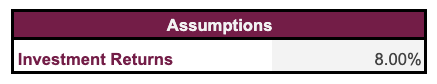
You can toggle your expected returns here. I set it at 8% as default:
And then you can let the spreadsheet do the rest of the analysis for you. It should look something like this:
So, if like me you end up trying to decide between paying down your mortgage or investing, you can calculate out the best option for your specific mortgage.
Please let me know if you run into any issues with the spreadsheet in the comments. Thanks!
I’m trying to use this file, but I can’t seem to make a copy. It just says:
“Sorry, unable to open the file at present.
Please check the address and try again.”
Could you make sure the link is working? Thank you so much.
Hey Elle,
I just double checked and it looks like the links are working. Can you try again?
If that doesn’t work, I’ll email you and have you send me a screenshot.
Hi there,
THanks for your response. It looks like my google drive account was full which is why it wouldn’t work for me. I got it on my other account instead. Thank you! Elle
Anytime!
It would be nice to have this all duplicated but for mortgage recasts instead. So instead of putting in a lump sum and reducing the loan duration and then investing after the mortgage is paid off, recast the mortgage and invest the difference between the previous payment and the new payment. This may work in your favor because you can put more in the market because of the reduced monthly payment (at the expense of paying more interest and extending your loan duration to the original amount).
I’ll see if I can add this as an option at some point. In general I am not a fan of mortgage recasting since it doesn’t lower your term, but would be interesting to look at it from the investment/net worth side. Also, with interests rates rising, recasting could actually become more attractive, so that is something to consider too.
I attempted to do this myself, but it would be good to get a second pair of eyes on it. It seems to suggest recasting is better because you can then immediately start investing the difference between your previous mortgage and the new one (unless my math is wrong): https://docs.google.com/spreadsheets/d/1_WtsLbPFsLVkp7xJ3JOBUe-1MH7Jgk3Uty0XXFFmLao/edit?usp=sharing
This looks good! I think you did get everything right. I need to double check the logic holds up under multiple scenarios, but it makes sense that in this situation at 50% that recasting is the winner since it gives you such a large monthly payment reduction that can be invested. Perhaps I can take what you’ve done and figure out a way to add in recasting as an option to look at for each payment amount?
I like the tool, but I don’t understand why the mortgage balance is subtracted from the Net Worth column. Since that column only includes your investments + your equity in the house (and not the full house value), subtracting the mortgage balance is effectively subtracting it twice. Your net worth should only be your investments + your home equity as that’s what you would have left in hand if you were to sell off everything.
It seems like the analysis would be misleading as it currently stands, and a steady 8% return would always come out ahead of paying off any portion of a mortgage under 8%.
On the mortgage balance – If you wanted to add in the market value of the house and any appreciation, you could simply add it to all of net worth columns, but it wouldn’t change the results because that remains constant. But it still needs to be subtracted, because it is a liability.
This came out of me wanting to look at a 10 year time horizon. On a 20 or 30 year horizon, you are correct the 8% wins every time. For me it was trying to determine if I should pay off our house now, or in 10 years, or if there was a 3rd option.
Your equity is the asset value (home price) minus the liability (mortgage balance), so the liability has already been accounted for when looking at the equity. You don’t need to subtract it again.
If you decided to cash out your net worth at the end of the ten years, the cash you’d have in hand would be the equity built up in your home (which is the amount left over after paying off the mortgage) and whatever your investments were worth. There would be no additional liability to pay back.
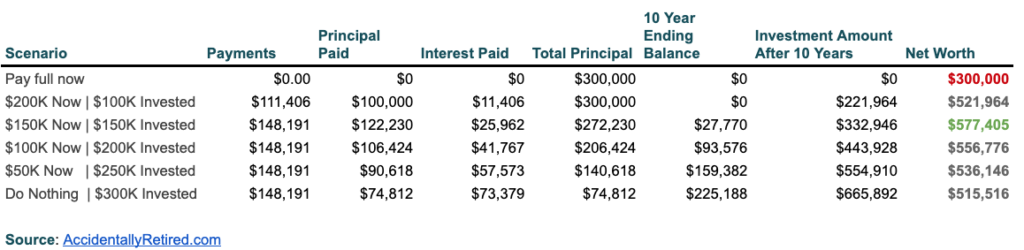
Just to illustrate using the table on this page… if you were to walk away and sell your house in ten years:
In the “$200K Now” scenario, you’d walk away with $300,000 (as shown in Total Principal)
In the “Do Nothing” scenario, you’d walk away with $74,812. You wouldn’t walk away with $74,812 – $225,188 = -150,376. Which is what your Net Worth column implies.
After reviewing, you are 100% correct. I’ve erred and double counted the liability, which has given everyone incorrect information. I’ll be updating and issuing a correction. THANK YOU for pointing this out. It firmly shows that investing in all scenarios is the superior option.
Hey Mitch, I’ve updated and added market value of the home, plus investment returns for the home as well: https://docs.google.com/spreadsheets/d/1YoGvzK8hv6r-bNrtaBChA9K9CzmXABilykXQnOZ99jY/copy#gid=460792277
Thanks! Love the additions of the Real Estate Returns calculations. The tool looks fantastic now.
One small catch… the “Market Value After X Years” header doesn’t update with the “Scenario Length” field value.
Good catch. Fixed!
It appears your pay full now scenario does not take into account monthly money going into an investment. To make the pay full now vs 100% invested apples to apples, seems like you should be adding whatever amount you would be putting into a monthly mortgage into an investment at calculate that at the same investment returns rate. Otherwise the total amount of money put into the comparison is not the same. For example, in the 100% invested scenario you are taking on principle put in. Would one not be putting that $$ into an investment in the pay full scenario. Unfortunately it is an apples to oranges comparison.
Hey Luis, you are 100% correct in that you want to take a real look at if you were investing the money every month. That is already in the spreadsheet in the second scenario “Pay Full Now + Dollar Cost Averaging” – that is the scenario you are describing.
Why doesn’t the spreadsheet consider the growth of the value of equity put into the home over the same time period in the scenarios where some or all of the mortgage is paid off?
Column J is going to count any equity you are accumulating/saving, and that gets added together with column K (your invested money) to come up with a “Net Worth.” In either scenario the growth in market value of the house will be the same, which is why market value is being ignored.
Is the market value of the home in ten years staying the same because the spreadsheet assumes no home appreciation? Is that accounted for elsewhere? Or should that not be considered, even if it is appreciating?
IMO it doesn’t matter. The house appreciates in either scenario whether you pay it off or invest.
Smart, I got to that same conclusion while waiting for your reply!
Thank you!
Sorry one last question. If the full mortgage is paid off and we assume the monthly payment savings are invested each month into the market with the same market returns upside, how would this look different?
My wife and I are building in a 55+ community, with completion expected Dec 2021. Sale price is $500,000, and we are putting $100,000 down, so the principal will be $400,000.
Based on your calculator, it is best to make a one time payment of $266,000. How soon should we do that?
I can’t/don’t want to give financial advice. I would say just do whatever works best for you. The calculator is a tool to help make a decision, but only you know how to best do that.
As far as early payments go, I believe you can make them as soon as your mortgage is setup and online, but will depend on your mortgagee.
Ok – @TPM – this is added in here: https://docs.google.com/spreadsheets/d/1YoGvzK8hv6r-bNrtaBChA9K9CzmXABilykXQnOZ99jY/edit?usp=sharing
I also built out the calculator to dollar cost average any additional mortgage payments in scenarios in which the mortgage was paid down in less than the time frame.
Also added a time frame input as well!
Interesting analysis, I like it! I recently paid down and will pay off the rest of our mortgage in the coming months. Agree completely, mathematically it doesn’t make sense given the stock market usually produces better returns. But there is higher volatility for sure.
I wonder how it would look on your calculation if you dollar cost average the money you would have spent on your mortgage back into investments. So, you spend 300,000 now and free up 1,500 per month or so. Use that money to invest and grow over the remaining life of the mortgage. It won’t catch up, i think, but still interesting to compare.
Paying off the mortgage for me was essentially a bond allocation alternative, lower our risk and lower our expenses.
Yeah you are right that I should add in an additional row/option with dollar cost averaging the freed up payments. Here is what I got from punching this in here: https://www.investor.gov/financial-tools-calculators/calculators/compound-interest-calculator
Results: $524,109 Net Worth. $300K + $224,109
So, if you do contribute your exact mortgage payments via dollar cost averaging to the market, you will come out in great shape as well. Less than the 50/50 option, but you’d have more piece of mind.